Going CPU bound
(An optimisation journey in Elixir)
David Klemenc

About me
- Started programming work for IskraTel in 2007
- Moved on to medical research work on holters
- Now work at a fintech company BlueOcean

Introduction
I'm going to present findings from four months of performance optimisations
where our team was tasked with creating a transaction service that can
handle 40_000 transactions per second on a single node.
I'll present our team's process and the insights we gained along the way. Much of the performance came from general DB optimisations (Postgres), but I'll focus on simulating traffic and on critical characteristics of standard library functions.
Before achieving the desired performance on the main server it was necessary to simulate an appropriate amount of traffic with a distribution similar to our current one.
Starting point
- Experience with a medium traffic server (2000 req/s)
- Experience with monitoring traffic and errors with
telemetry/ Prometheus / Grafana - A Mocking tool (built with Elixir) to simulate traffic (Pareto distribution - 80/20 Rule)

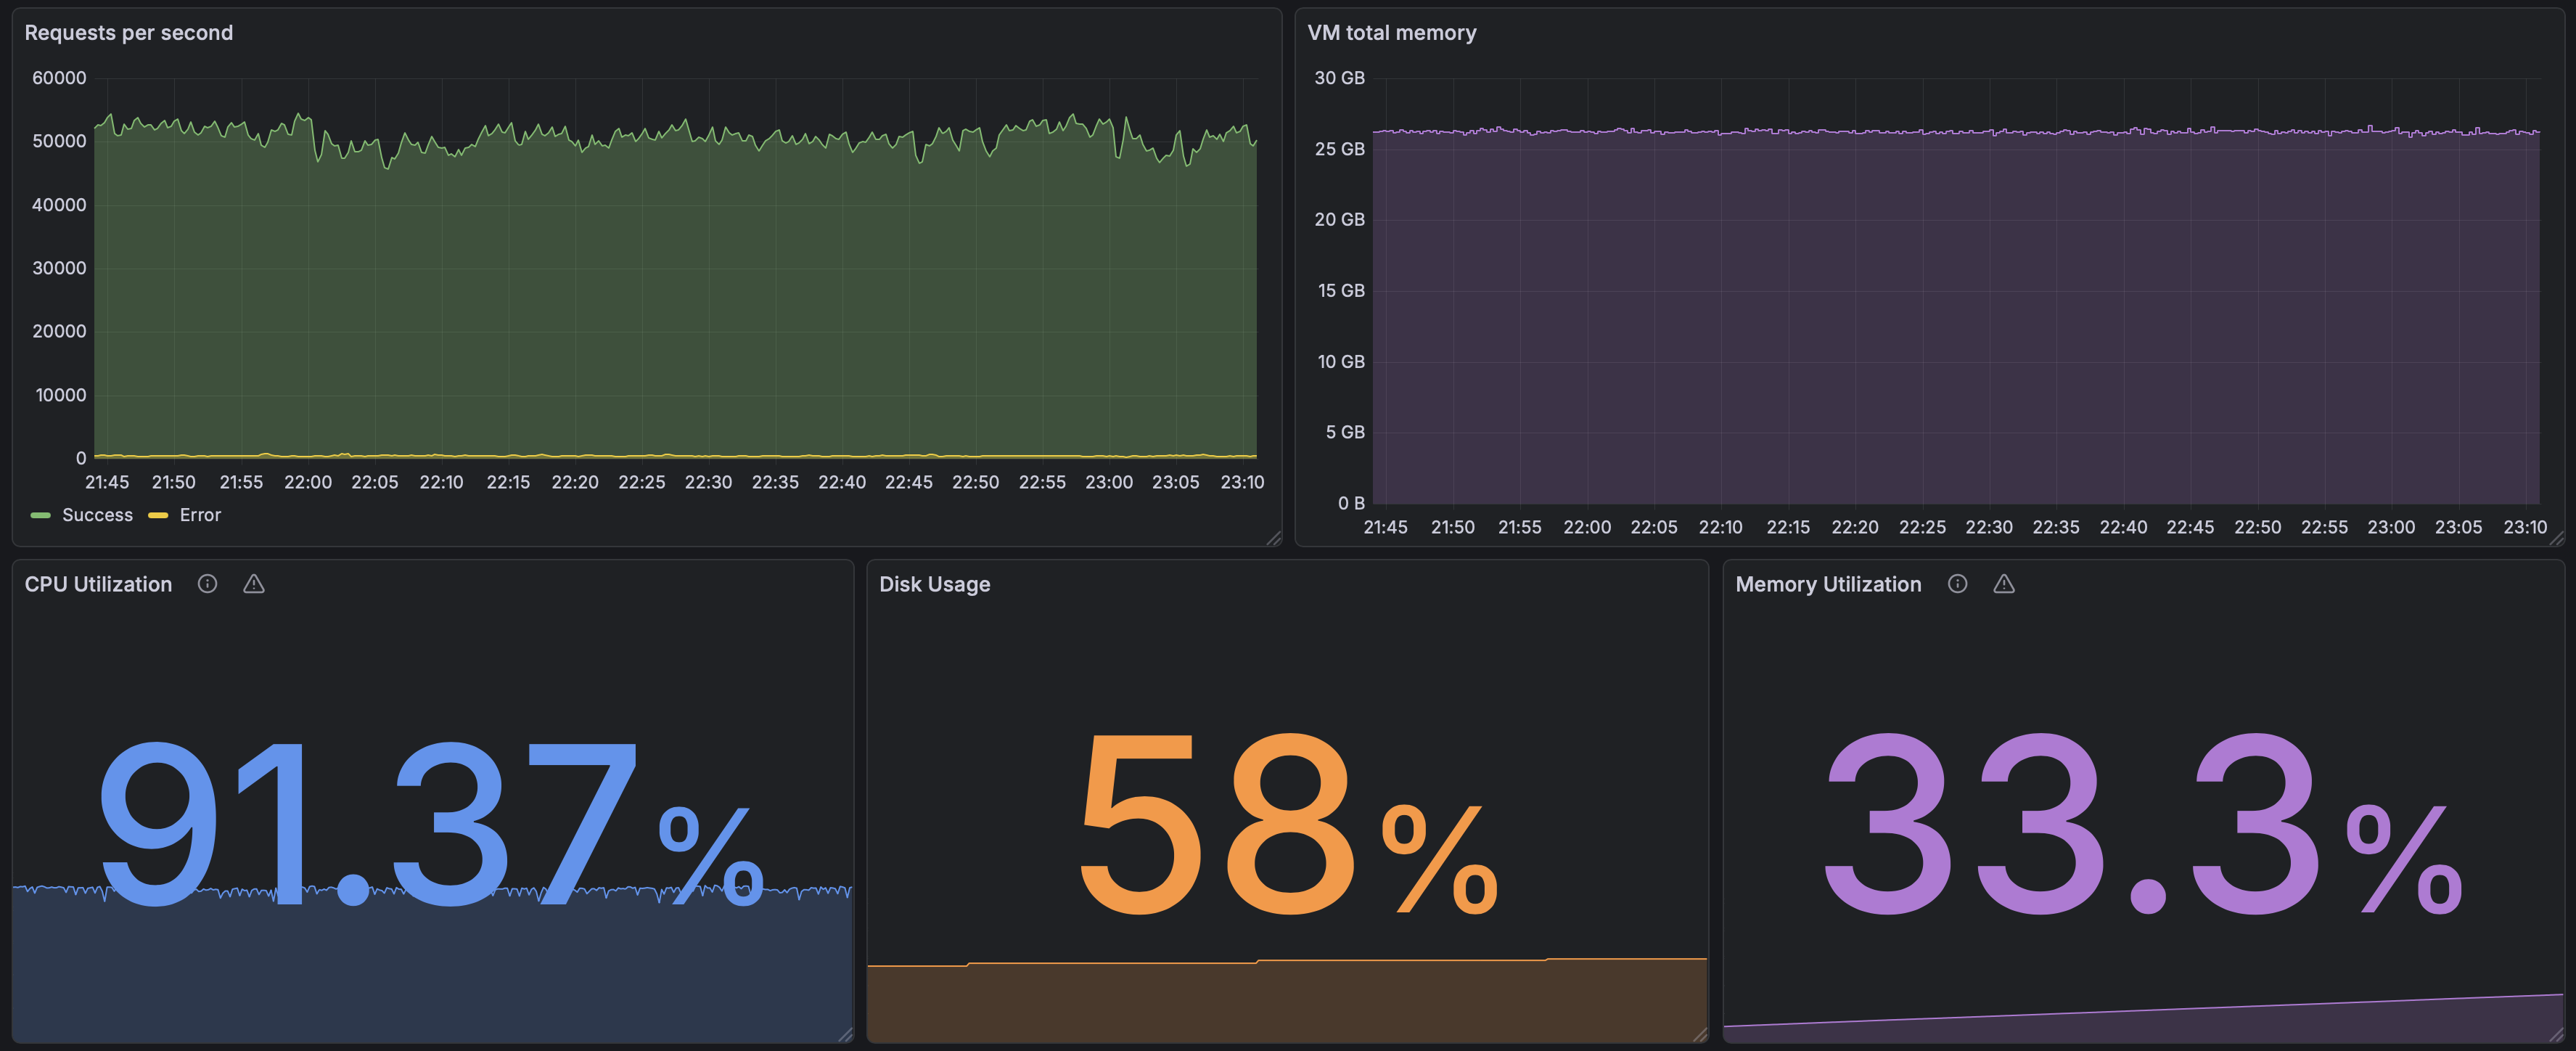
Monitoring setup
Monitoring setup (dummy endpoint)
Key measurements
- Requests per second
- Beam VM memory consumption
- CPU utilization
- Disk usage
- Memory utilization
Methodology
We started by upgrading and optimizing our internal mock tool, so we could measure performance impacts from various code changes and also get a lower bound on hardware requirements.
The starting test bench was a production server with a single endpoint that did nothing but return 200 OK, which we tested against our first mock implementation that served requests and waited for a reply. This served as a best-case scenario and a check if everything worked as expected (it did not).
Methodology

Methodology

Logging
Latency numbers every programmer should know
| Operation | Category | Typical latency |
|---|---|---|
| Register / increment (1 CPU cycle) | CPU | 0.3 ns |
| L1 cache reference | CPU | 1 ns |
| Branch mispredict | CPU | 3 ns |
| L2 cache reference | CPU | 4 ns |
| Main memory (RAM) access | Memory / OS | 100 ns |
| Context switch | Memory / OS | 1–3 μs |
| NVMe SSD read (4 KB) | Local I/O | 100 μs |
| Roundtrip in same datacenter | Local I/O | 500 μs |
| HTTP call, same region | Network | 10–50 ms |
| Third-party HTTPS API (Stripe, Twilio) | Network | 100–500 ms |
Since logging is an I/O operation - the question is how much are we paying for it?
Sidenote - tech stack (Rust, TigerBeetle DB ...)
Legacy logging setup
On our mocking tool we used to have 3 loggers:
- default logger (standard io)
- file logger (we once used to run platform mock without systemd as a daemon)
- mnesia logger (so we could see logs on our frontend)
Logging quick test
To answer the question - does logging have an impact on performance?
We just turned it OFF
The result was a nice 40% performance gain!
HTTP client
We started by using the built-in :httpc module which was a good choice.
Some performance improvements can be made by using HTTP/2 so we switched to the Finch library.
Sidenote (HTTP/2)
Both HTTP/1.1 and HTTP/2 should take into consideration the concurrency setting.
#HTTP/1.1
pool_count * pool_size > concurrency
HTTP/2 multiplexes up to 100 requests in a single connection - therefore the minimum pool_count is:
#HTTP/2
min_pool_count = concurrency / 100
The following formula is a good starting point for experimentation.
pool_count = 3 * (concurrency / 100) |> round()
Finch telemetry
Added start_pool_metrics?: true to application.ex
%{
  :default => [size: 12000, protocols: [:http1], start_pool_metrics?: true]
}
# Finch metrics
Metrics.distribution(
  "finch.request.duration.milliseconds",
  event_name: [:finch, :request, :stop],
  unit: {:native, :millisecond},
  tags: [:name],
  measurement: :duration,
  reporter_options: [
    buckets: [50, 100, 200, 400, 800, 1600]
  ]
),
Metrics.counter(
  "finch.request.error.count",
  event_name: [:finch, :request, :exception],
  tags: [:name, :kind]
)
Receiving Finch telemetry data
GOOD - we see telemetry on Grafana
But ...
Speed test
Things were progressing but we ran into a bottleneck.
CPU utilization

Task.async_stream
This function has an interesting option :max_concurrency, from the Elixir documentation:
Options
:max_concurrency- sets the maximum number of tasks to run at the same time. Defaults toSystem.schedulers_online/0.
Example
stream = Task.async_stream(
  collection,
  Mod,
  :expensive_fun,
  [],
  max_concurrency: max_concurrency
)
Enum.to_list(stream)
Code Beam async_stream
Concurrency Test
defmodule ConcurrencyTest do
  def async_stream_test({range, max_concurrency}) do
    range
    |> Task.async_stream(
      fn _ ->
        Process.sleep(10)
        1
      end,
      max_concurrency: max_concurrency,
      ordered: false,
      timeout: :infinity
    )
    |> Stream.run()
  end
end
tests = 100..2000//100
  |> Enum.map(fn concurrency -> {1..1_000_000, concurrency} end)
  |> Enum.map(fn {_, concur} = args ->
    start = System.system_time(:millisecond)
    ConcurrencyTest.async_stream_test(args)
    stop = System.system_time(:millisecond)
    %{concurrency: concur, duration: stop - start}
  end)
Code Beam async_stream
nested_async_stream
defmodule ConcurrencyTest do
  def nested_async_stream({range, concurrency}) do
    chunk_size = 100
    outer_concurrency = div(concurrency, chunk_size)

    range
    |> Stream.chunk_every(chunk_size)
    |> Task.async_stream(
      fn chunk ->
        chunk
        |> Task.async_stream(
          fn _ ->
            Process.sleep(10)
            1
          end,
          max_concurrency: chunk_size,
          ordered: false,
          timeout: :infinity
        )
        |> Stream.run()
      end,
      max_concurrency: outer_concurrency,
      ordered: false,
      timeout: :infinity
    )
    |> Stream.run()
  end
end
tests = 100..2000//100
  |> Enum.map(fn concurrency -> {1..1_000_000, concurrency} end)
  |> Enum.map(fn {_, concur} = args ->
    start = System.system_time(:millisecond)
    ConcurrencyTest.nested_async_stream(args)
    stop = System.system_time(:millisecond)
    %{concurrency: concur, duration: stop - start}
  end)
Flow
Computational flows with stages.
Flow allows developers to express computations
on collections, similar to the Enum and Stream modules,
although computations will be executed in parallel using
multiple GenStages.
Using nested async_stream we got to a couple of thousand concurrent requests,
to go further we switched to Flow that allowed us to simulate our target concurrency of 20_000
CPU utilization after Flow

Encoding JSON
We have multiple options for JSON encoding:
JSON.encode!/2JSON.encode_to_iodata!/2
This is the most efficient format if the JSON is going to be used for IO purposes.
But since the data format we are using to simulate traffic is not going to change there is another option
EEx
Benchee setup EEx JSON encoder
defmodule EExJsonEncoder do
  require EEx

  defp bool(true), do: "true"
  defp bool(false), do: "false"

  template = """
  {"param_a":"<%= t.param_a %>",\
  "param_b":"<%= t.param_b %>",\
  "param_c":"<%= t.param_c %>",\
  "param_d":<%= bool(t.param_d) %>,\
  "param_e":"<%= t.param_e %>",\
  "param_f":"<%= t.param_f %>",\
  "param_g":"<%= t.param_g %>",\
  "param_h":"<%= t.param_h %>",\
  "param_i":<%= bool(t.param_i) %>,\
  "param_j":<%= bool(t.param_j) %>,\
  "param_k":<%= bool(t.param_k) %>,\
  "param_l":<%= bool(t.param_l) %>,\
  "param_m":<%= bool(t.param_m) %>,\
  "param_n":"<%= t.param_n %>",\
  "param_o":"<%= t.param_o %>",\
  "param_p":"<%= t.param_p %>",\
  "param_r":"<%= t.param_r %>",\
  "param_s":<%= Integer.to_string(t.param_s) %>,\
  "param_t":"<%= t.param_t %>",\
  "param_u":"<%= t.param_u %>",\
  "param_v":"<%= t.param_v %>"}\
  """

  EEx.function_from_string(:def, :encode, template, [:t])
end
Benchee run
Benchee.run(
  %{
    "JSON.encode!" => &JSON.encode!/1,
    "JSON.encode_to_iodata!" => &JSON.encode_to_iodata!/1,
    "EEx template" => &EExJsonEncoder.encode/1
  },
  inputs: %{
    "sample" => TestData.sample()
  },
  time: 5,
  warmup: 2,
  memory_time: 2,
  reduction_time: 2,
  print: [fast_warning: false]
)
JSON benchee results
Name                             ips        average
EEx template                719.37 K        1.39 μs
JSON.encode_to_iodata!      116.67 K        8.57 μs
JSON.encode!                109.08 K        9.17 μs

Comparison:
EEx template                719.37 K
JSON.encode_to_iodata!      116.67 K - 6.17x slower +7.18 μs
JSON.encode!                109.08 K - 6.59x slower +7.78 μs

Memory usage statistics:

Name                      Memory usage
EEx template                 0.0859 KB
JSON.encode_to_iodata!         4.47 KB - 52.00x memory usage +4.38 KB
JSON.encode!                   4.53 KB - 52.73x memory usage +4.45 KB
Lessons learned
- Track and document your progress and regressions with dates (and commits)
- When simulating traffic - simulate a lot (in our case we are simulating 500M requests - the full simulation lasts over 1h!)
- (a queuing system can be very helpful)
- Do not log everything - every IO operation has a cost!
- Do not put telemetry on everything (measure cost)!
- The server generating traffic must be much faster than the expected speed of the server consuming traffic. (in our case
250_000 req/svs40_000 req/s)